

This post has been reposted from the CompassRed blog
If you’re doing any Google Analytics dashboard work, chances are you’re using Google’s Data Studio dashboard product. It’s an easy to use tool, the connection to data sources is seamless, and functionality is frequently being added. With the addition of custom JavaScript/CSS visualizations, there are many chart types and custom representations of data now available.
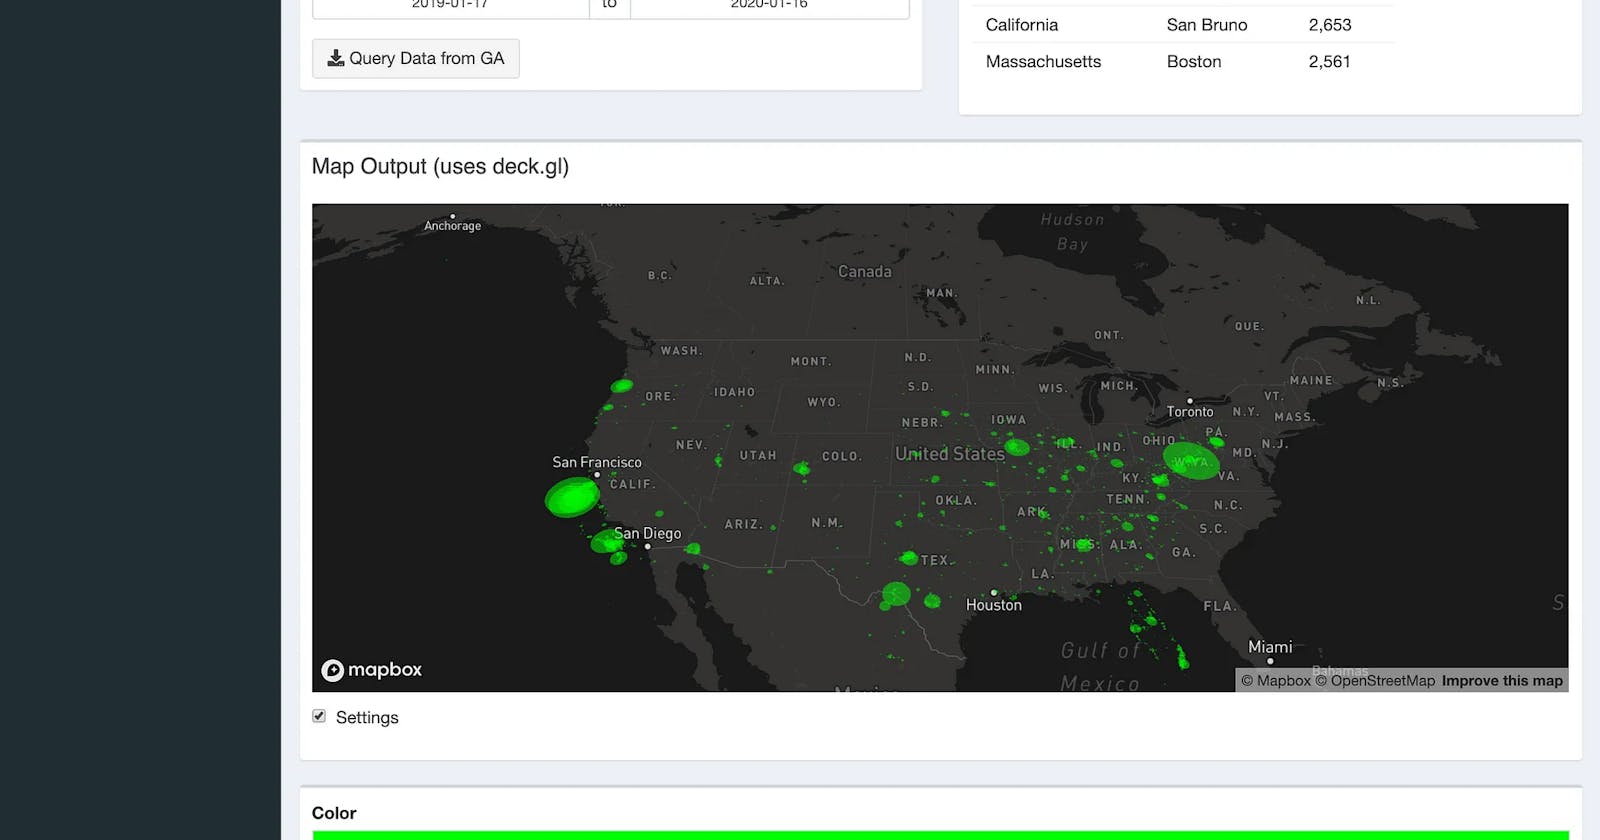
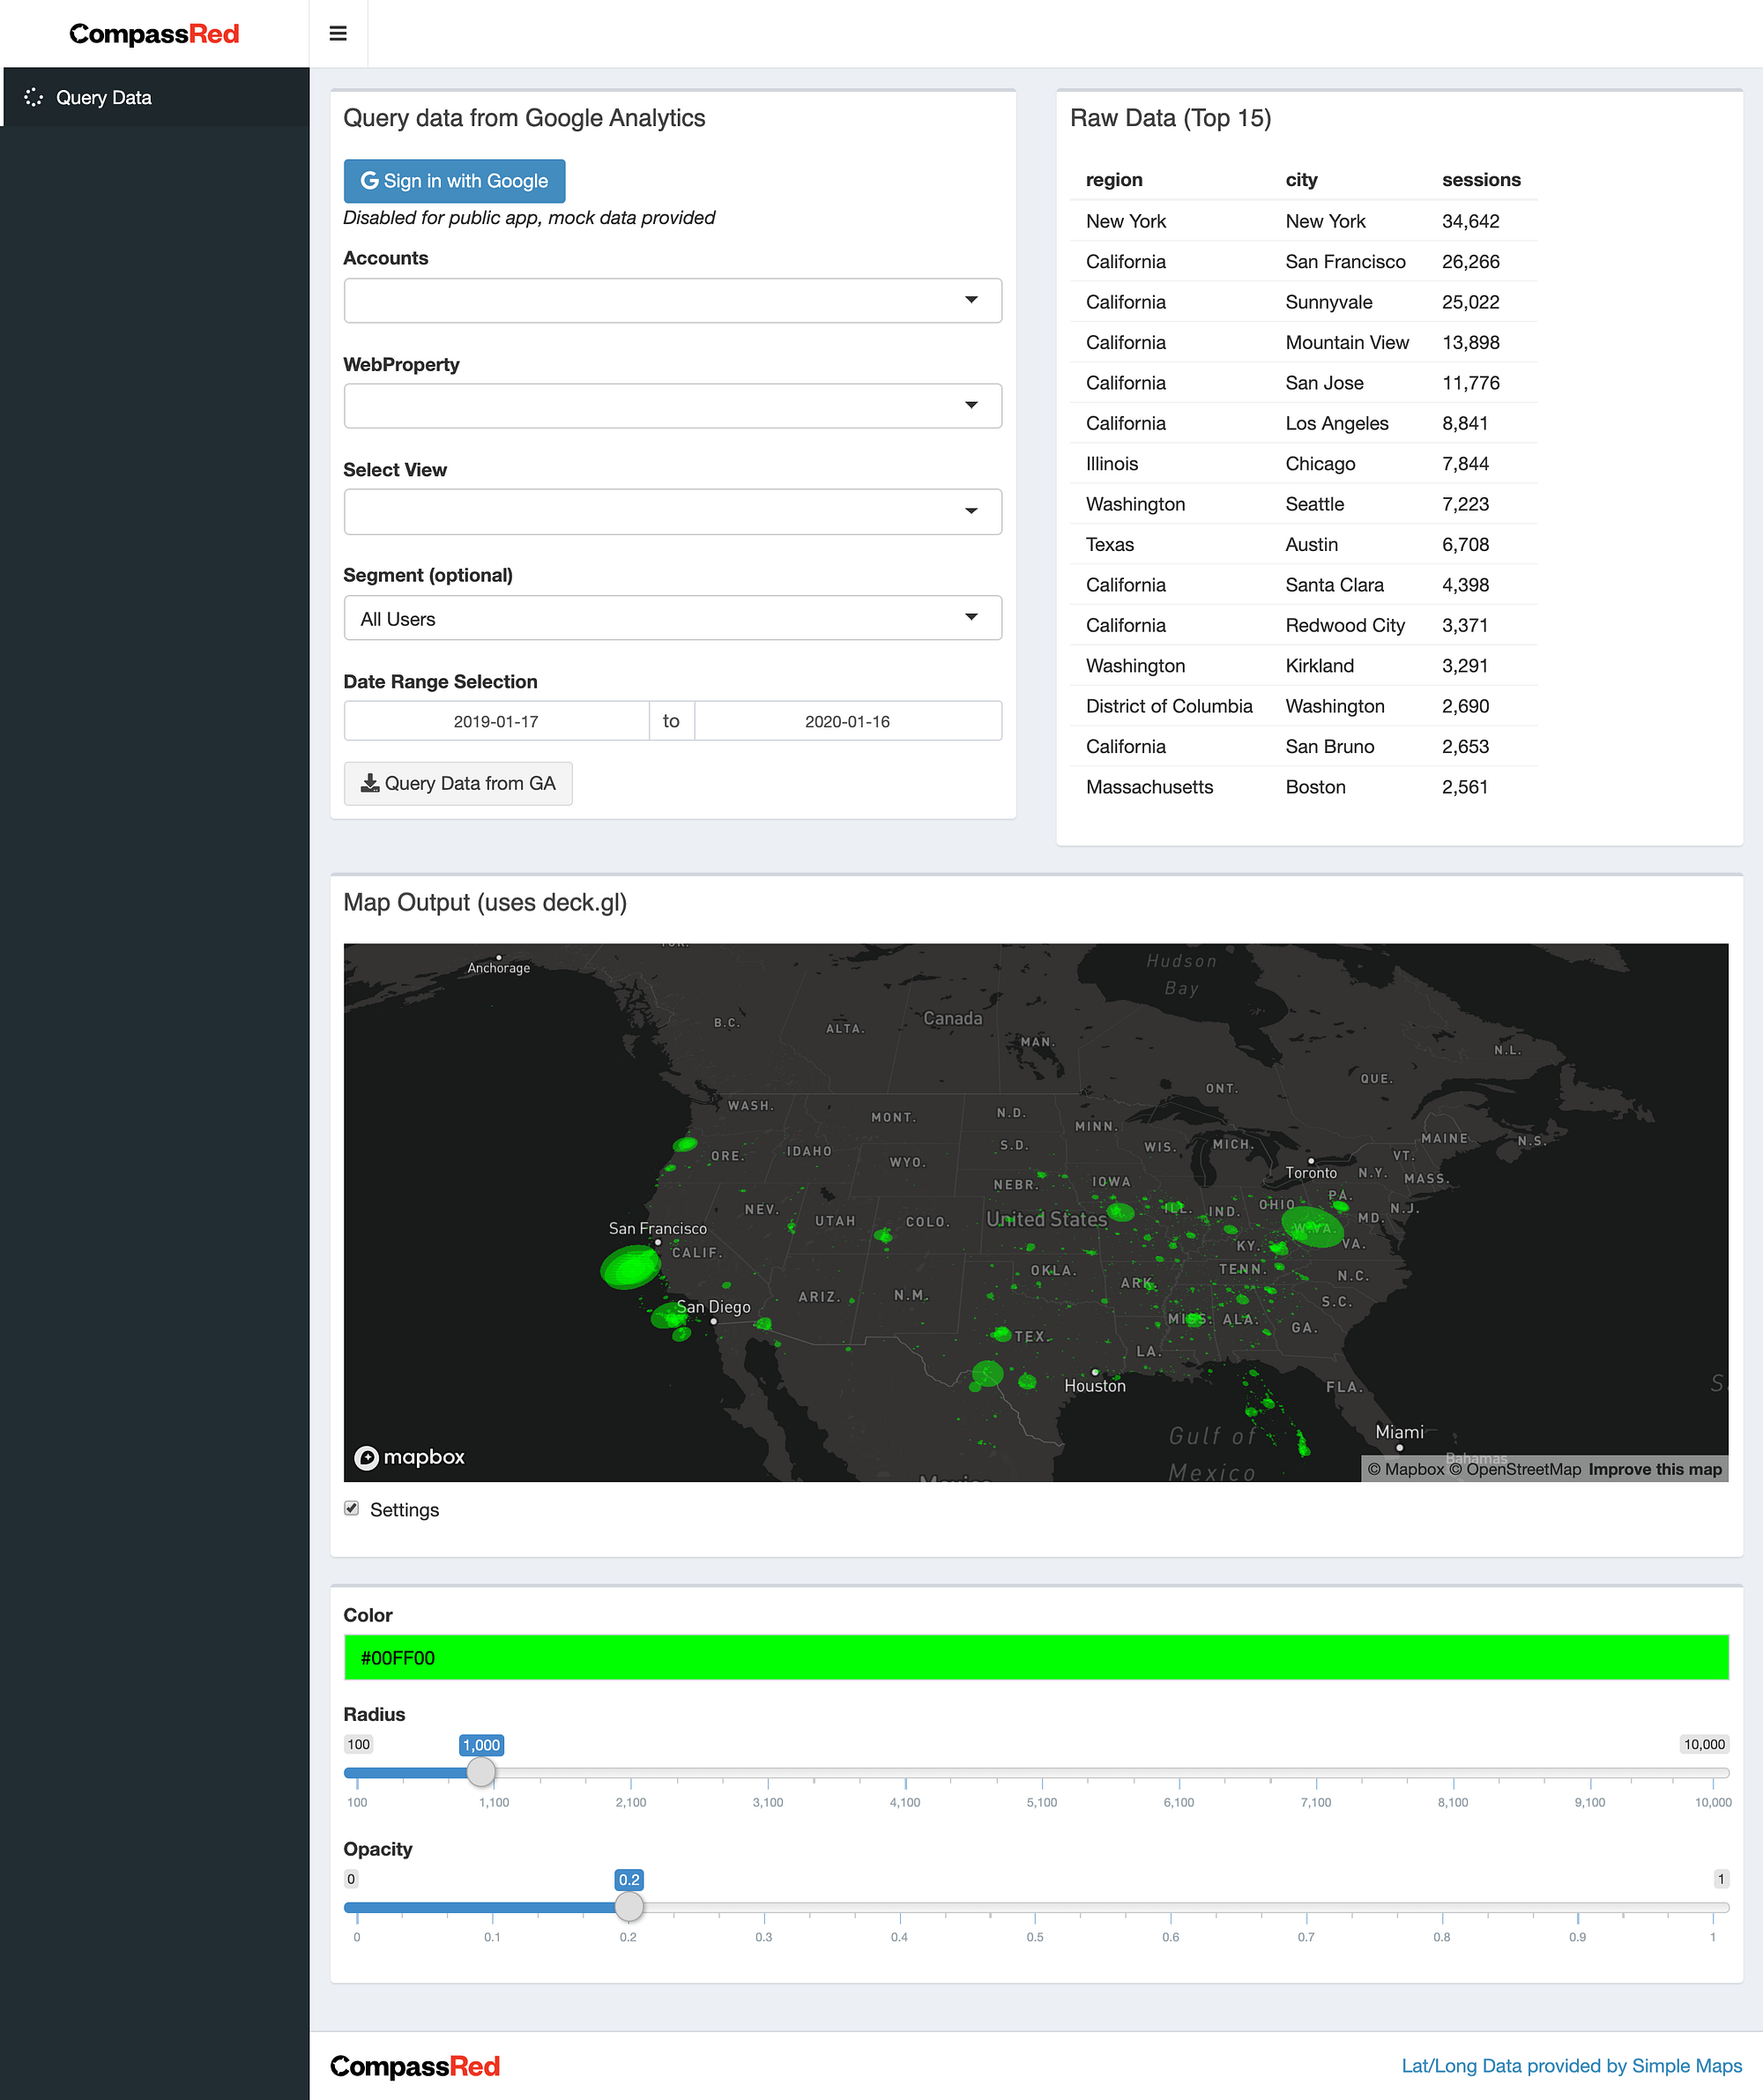
But one feature not yet available in these custom visualizations is external requests; all code being used in custom visualizations must be included in the source code of the visualization. Although there are many use cases for making external requests in Data Studio, one that stands out is geographic mapping. Below you can see a proof-of-concept R Shiny app that uses the *uber-*cool deck.gl framework and Mapbox to visualize geographic GA data that’s been merged with a lat/long lookup table.
If the above link does not work, please refer to the screenshot. Below it, I’ll discuss some high-level benefits of using R Shiny, share a Shiny dashboard template, and walk through steps to get your own Google Cloud Project setup.
Why R Shiny?
The answer here is simple: we stand on the shoulders of giants. Mark Edmonson has created what he’s dubbed the googleAuthRverse, a wide array of R packages focused on interacting with Google products and services. The package I’ve used most is googleAnalyticsR, built to handle the querying and transformation of Google Analytics API data. Outside of dashboards, this package (along with the vast R ecosystem) is capable of automating a large part of the “reporting monkey” work that many analysts find themselves in.
Behind googleAnalyticsR is googleAuthR, the Google authentication back-end (planned to be 100% replaced by gargle). The Shiny authentication module googleAuth() included in googleAuthR allows a user to authenticate with Google. After authentication, the account, property, and view dropdowns are driven by the authDropdown() Shiny module. Once you have the data, the world is your oyster. In the above example I’m using:
shinydashboard/shinydashboardPlusto create a bootstrap interfacedeckglto visualize (which handles the Mapbox base layer)shinyjsto toggle a settings box
Other standard dashboard elements can be added from packages like plotly for charts and shinydashboardPlus for scorecard metrics.
There are loads and loads and loads of cool Shiny apps out there showing what’s possible. Whether you’re creating a custom visualization in Google Data Studio or a fully-fledged custom application in Shiny, there’s a lot that’s possible when you get your hands directly on Google Analytics data.
Try it out!
The section below provides some hand holding on the Google project setup which took a bit of testing and breaking to figure out in the context of a Google Analytics Shiny app. Note that I won’t be covering the R/Shiny development process (good intro resource here).
I’ve provided the source code of the above example here and a Shiny GA dashboard template here.
In order to serve a Google login experience in your app you’ll need to create a project in Google Cloud Platform (signing up for a GCP account might require a credit card but what we’re setting up won’t incur any charges). After creating a project, you’ll need to enable the Google Analytics APIs. Navigate to APIs & Services in the left hand navigation and go to Library.
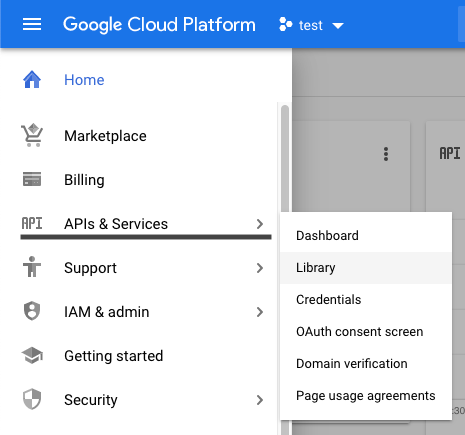
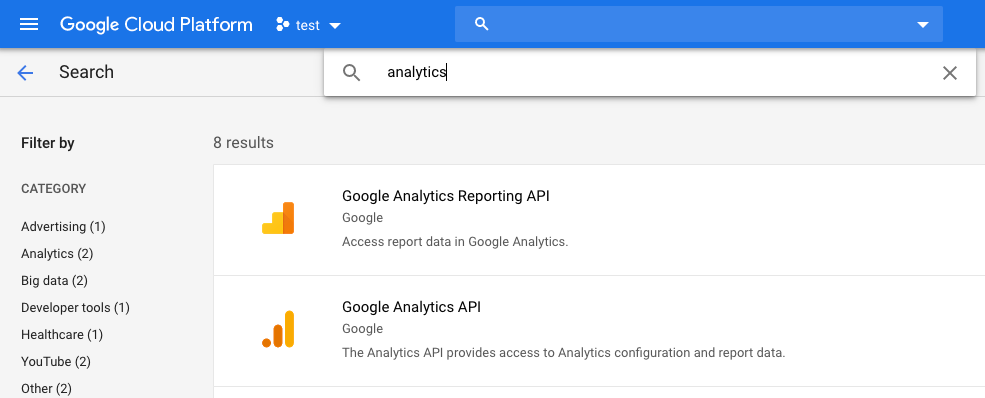
Then search for “analytics” and enable the Google Analytics Reporting API as well as the Google Analytics API (this one is for requests GA user metadata).
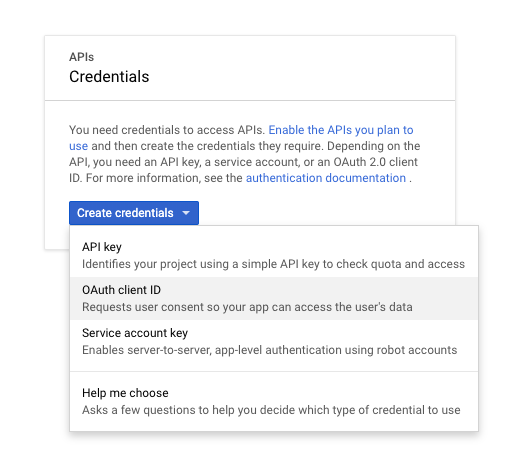
Click on each and then enable the API. After that, navigate to Credentials under APIs & Services in the left hand navigation. You’ll need to create an OAuth client ID credential to give the app.
Before creating an OAuth client ID for the first time, you’ll have to configure a consent screen. This is the interstitial screen users will see when authenticating to Google that shows the app title and a support email. One callout is you’ll need to add the domains your app is running on.
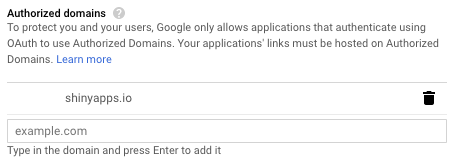
After configuring the consent screen you’ll now be able to create the OAuth client ID. You’ll need to add the authorized domains your app is running on (add localhost for development purposes) as well as the authorized redirects (be sure to add the localhost port you’re developing on).

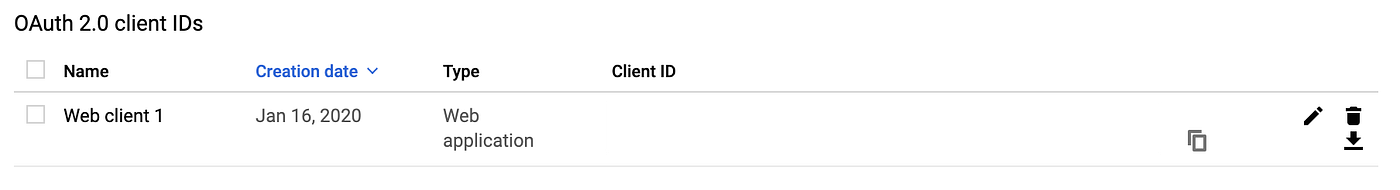
Almost there! Now that you’ve created the client ID, you can add it and the secret to the app. Download the file, rename it client-web-id.json, and place it in your app’s directory.
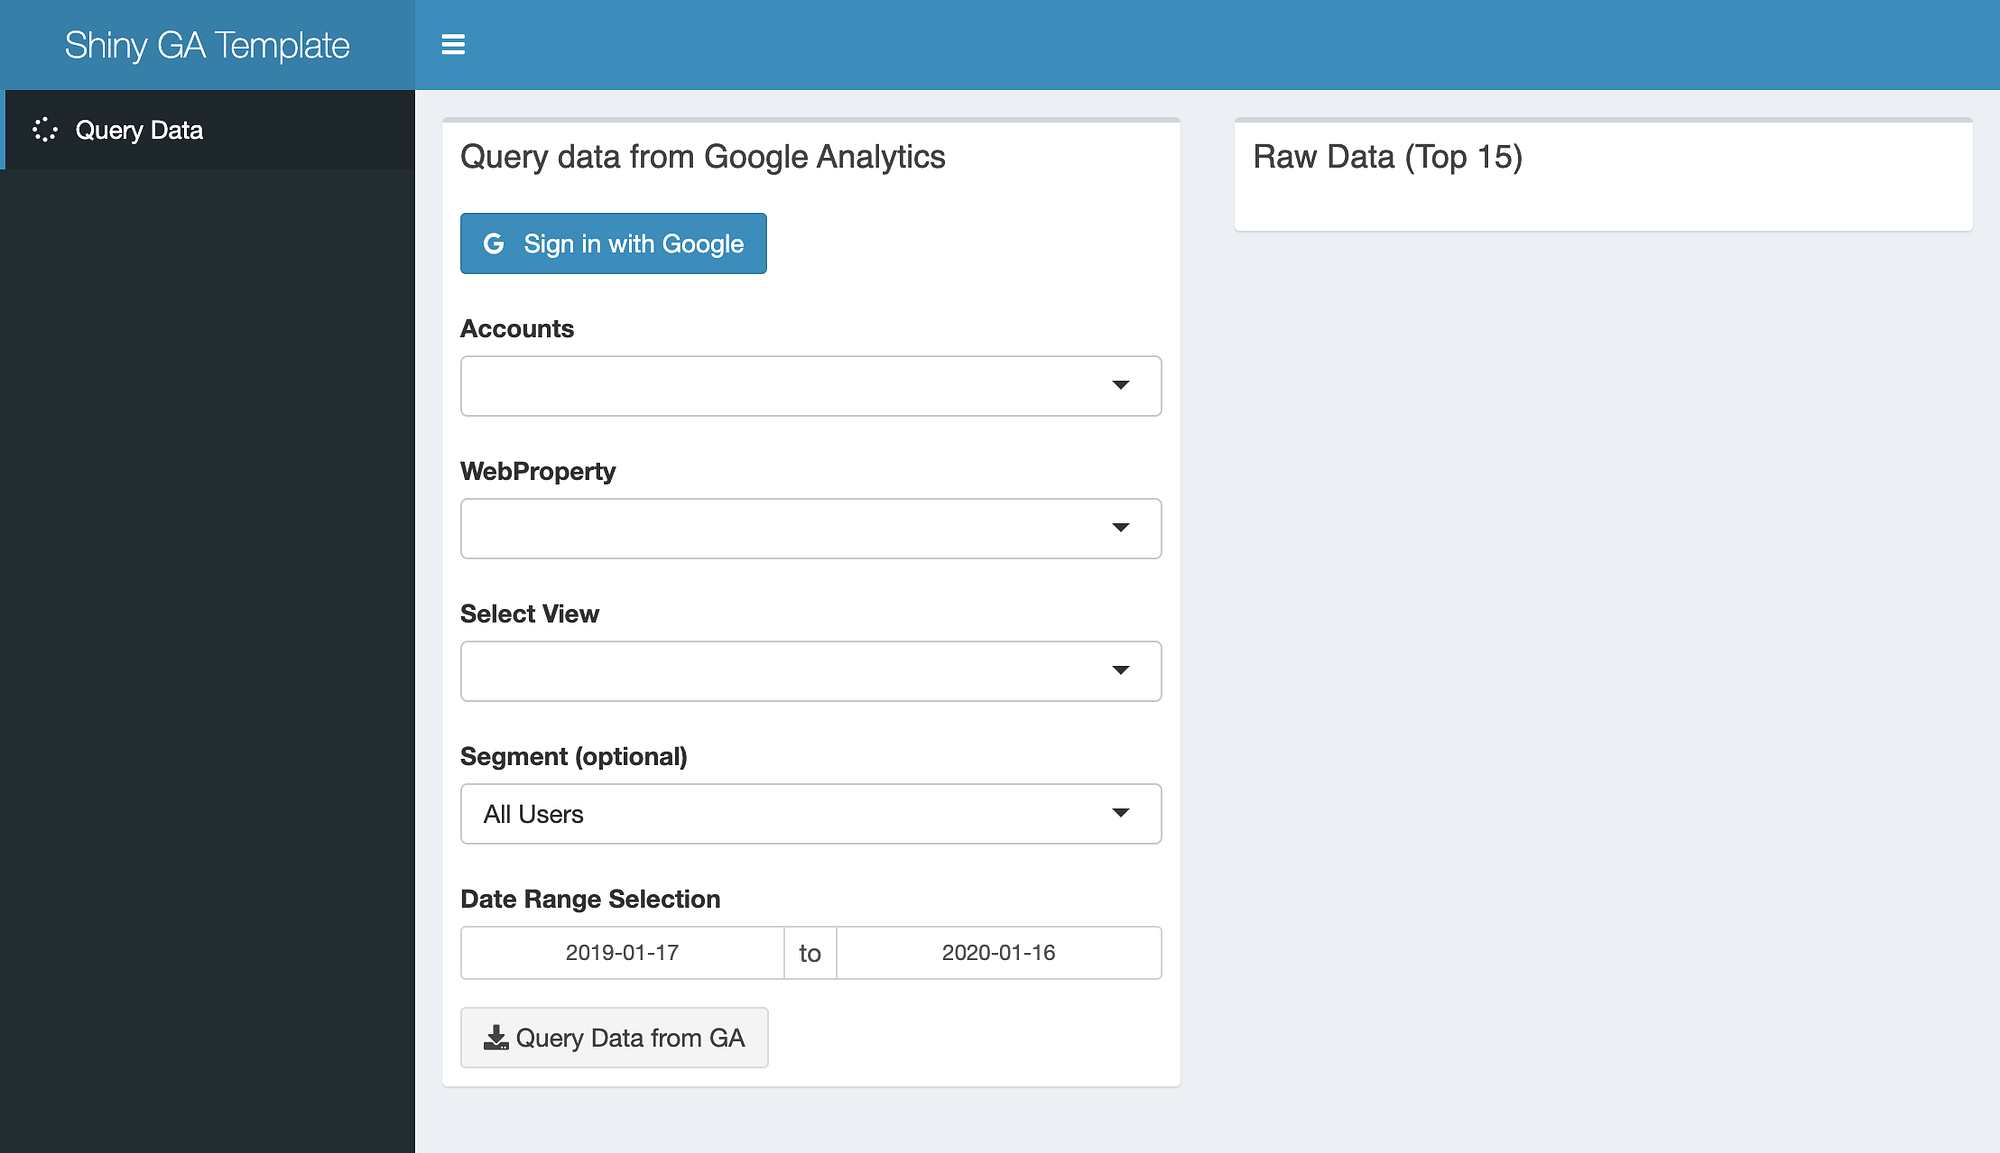
Hopefully, at this point, you’re able to trigger a Google authentication flow when clicking on the “Sign in with Google” button!